
1
UNITED STATES
SECURITIES AND EXCHANGE COMMISSION
WASHINGTON, D.C. 20549
__________________________
FORM
__________________________
CURRENT REPORT
Pursuant to Section 13 or 15(d) of the Securities Exchange Act of 1934
Date of Report (Date of earliest event reported):
__________________________
(Exact name of Registrant as Specified in Its Charter)
(State or Other Jurisdiction
of Incorporation)
(Commission File Number)
(IRS Employer
Identification No.)
,
,
(Address of Principal Executive Offices)
(Zip Code)
Registrant’s Telephone Number, Including Area Code: (
)
Check the appropriate box below if the Form 8-K filing is intended to simultaneously satisfy the filing obligation of the registrant under
any of the following provisions:
☐
Written communications pursuant to Rule 425 under the Securities Act (17 CFR 230.425)
☐
Soliciting material pursuant to Rule 14a-12 under the Exchange Act (17 CFR 240.14a -12)
☐
Pre-commencement communications pursuant to Rule 14d-2(b) under the Exchange Act (17 CFR 240.14d-2(b))
☐
Pre-commencement communications pursuant to Rule 13e-4(c) under the Exchange Act (17 CFR 240.13e-4(c))
Securities registered pursuant to Section 12(b) of the Act:
Title of each class
Trading
Symbol(s)
Name of each exchange on which registered
Indicate by check mark whether the registrant is an emerging growth company as defined in Rule 405 of the Securities Act of 1933
(§ 230.405 of this chapter) or Rule 12b-2 of the Securities Exchange Act of 1934 (§ 240.12b -2 of this chapter).
Emerging growth company
If an emerging growth company, indicate by check mark if the registrant has elected not to use the extended transition period for
complying with any new or revised financial accounting standards provided pursuant to Section 13(a) of the Exchange Act.
2
Item 2.02. Results of Operations and Financial Condition.
On October 23, 2025, USCB Financial Holdings, Inc. (the “Company”) issued a press release announcing its financial results
for the quarter ended September 30, 2025. A copy of the press release is furnished as Exhibit 99.1 to this Current Report on Form 8-K
(“Form 8-K”) and is incorporated herein by reference.
The information in this Item 2.02, including Exhibit 99.1 hereto, is being furnished and shall not be deemed “filed” for purposes
of Section 18 of the Securities Exchange Act of 1934 (the “Exchange Act”), or otherwise be subject to the liability of that section, and
shall not be deemed to be incorporated by reference into any filing under the Securities Act of 1933 (the “Securities Act”) or the
Exchange Act except as expressly set forth by specific reference in such filing to this Form 8-K.
Item 7.01. Regulation FD Disclosure.
As previously announced, at 11:00 a.m. ET on October 24, 2025, the Company will hold an earnings conference call to discuss
its financial performance for the quarter ended September 30, 2025. A copy of the slides forming the basis of the presentation is being
furnished as Exhibit 99.2 to this Form 8-K and is incorporated herein by reference. A copy of the slides has also been posted to the
Company’s investor relations website, located at investors.uscenturybank.com.
The information in this Item 7.01, including Exhibit 99.2 hereto, is being furnished and shall not be deemed “filed” for purposes
of Section 18 of the Exchange Act, or otherwise be subject to the liability of that section, and shall not be deemed to be incorporated by
reference into any filing under the Securities Act or the Exchange Act except as set forth by specific reference in such filing to this Form
8-K.
Item 9.01. Financial Statements and Exhibits.
(d) Exhibits.
Exhibit No.
Description
99.1
99.2
104
Cover Page Interactive Data File (embedded within the Inline XBRL document)
3
SIGNATURE
Pursuant to the requirements of the Securities Exchange Act of 1934, the registrant has duly caused this report to be signed on
its behalf by the undersigned hereunto duly authorized.
USCB Financial Holdings, Inc.
By:
/s/ Robert Anderson
Name:
Robert Anderson
Title:
Chief Financial Officer
Date: October 23, 2025

1
Exhibit 99.1
EARNINGS RELEASE
USCB Financial Holdings, Inc. Reports Record Fully Diluted EPS of $0.45 for Q3 2025; ROAA of 1.27% and
ROAE of 15.74%
MIAMI, FL – October 23, 2025 – USCB Financial Holdings, Inc. (the “Company”) (NASDAQ: USCB)
, the holding company for
U.S. Century Bank (the “Bank”), reported net income of $8.9 million or $0.45 per fully diluted share for the three months ended
September 30, 2025, compared with net income of $6.9 million or $0.35 per fully diluted share for the same period in 2024.
“This marks our third consecutive quarter of record fully diluted earnings per share, reflecting the consistency and resilience of our
operating model,” said Luis de la Aguilera, Chairman, President and CEO. “Our profitability ratios place us among the top performing
peers in the industry, while our credit metrics and efficiency continue to compare favorably to peers. These results reflect disciplined
execution and a continued focus on long-term value creation.”
Unless otherwise stated, all percentage comparisons in the bullet points below are calculated at or for the quarter ended September 30,
2025 compared to at or for the quarter ended September 30, 2024 and annualized where appropriate.
Profitability
•
Annualized return on average assets for the quarter ended September 30, 2025 was 1.27% compared to 1.11% for the third quarter
of 2024.
•
Annualized return on average stockholders’ equity for the quarter ended September 30, 2025 was 15.74% compared to 13.38% for
the third quarter of 2024.
•
The efficiency ratio for the quarter ended September 30, 2025 was 52.28% compared to 53.16% for the third quarter of 2024.
•
Net interest margin for the quarter ended September 30, 2025 was 3.14% compared to 3.03% for the third quarter of 2024.
•
Net interest income before provision for credit losses was $21.3 million for the quarter ended September 30, 2025, an increase of
$3.2 million or 17.5% compared to $18.1 million for the same period in 2024.
Balance Sheet
•
Total assets were $2.8 billion at September 30, 2025, representing an increase of $264.0 million or 10.5% from $2.5 billion at
September 30, 2024.
•
Total loans held for investment were $2.1 billion at September 30, 2025, representing an increase of $199.6 million or 10.3% from
$1.9 billion at September 30, 2024.
•
Total deposits were $2.5 billion at September 30, 2025, representing an increase of $329.0 million or 15.5% from $2.1 billion at
September 30, 2024.
•
Total stockholders’ equity was $209.1 million at September 30, 2025, representing a decrease of $4.8 million or 2.3% from $213.9
million at September 30, 2024. Total stockholders’ equity included accumulated other comprehensive loss of $37.8 million at
September 30, 2025 compared to accumulated other comprehensive loss of $38.0 million at September 30, 2024.
•
On August 14, 2025, the Company entered into a Subordinated Note Purchase Agreement with certain qualified institutional buyers
pursuant to which the Company sold and issued $40.0 million in aggregate principal amount of its 7.625% fixed-to-floating rate
subordinated notes due August 15, 2035 in a private placement transaction. This transaction was conducted under the provisions of
Regulation D promulgated under the Securities Act 1933. The subordinated notes were issued by the Company to the purchasers at
a price equal to 100% of their face amount.
2
Asset Quality
•
The allowance for credit losses (“ACL”) increased by $1.9 million to $25.0 million at September 30, 2025 from $23.1 million at
September 30, 2024.
•
The ACL represented 1.17% of total loans at September 30, 2025 and 1.19% at September 30, 2024.
•
The provision for credit loss was $105 thousand for the quarter ended September 30, 2025, a decrease of $826 thousand compared
to $931 thousand for the same period in 2024.
•
The ratio of non-performing loans to total loans was 0.06% at September 30, 2025 and 0.14% at September 30, 2024. Non-
performing loans totaled $1.3 million at September 30, 2025 and $2.7 million at September 30, 2024.
Non-interest Income and Non-interest Expense
•
Non-interest income was $3.7 million for the three months ended September 30, 2025, an increase of $246 thousand or 7.2%
compared to $3.4 million for the same period in 2024.
•
Non-interest expense was $13.0 million for the three months ended September 30, 2025, an increase of $1.6 million or 13.9%
compared to $11.5 million for the same period in 2024.
Capital
•
On August 14, 2025, the Company entered into a Subordinated Note Purchase Agreement pursuant to which the Company sold and
issued an aggregate of $40.0 million of subordinated notes. The majority of the proceeds were used to repurchase 2.0 million shares
of Class A common stock from certain institutional shareholders through a privately negotiated transaction, at a weighted average
price per share of $17.19. The aggregate purchase price for these transactions was approximately $34.4 million. The repurchases
were supplemental and not part of the Company’s two previously announced stock repurchase programs. As of September 30, 2025,
528,309 shares remain authorized for repurchase under the Company’s two share repurchase programs.
•
On October 20, 2025, the Company’s Board of Directors declared a quarterly cash dividend of $0.10 per share of the Company’s
Class A common stock. The dividend will be paid on December 5, 2025 to shareholders of record at the close of business on
November 14, 2025.
•
As of September 30, 2025,
total risk-based capital ratios for the Company and the Bank were 14.20% and 13.93%, respectively,
well in excess of regulatory requirements.
•
Tangible book value per common share (a non-GAAP measure) was $11.55 at September 30, 2025, representing an increase of
$0.65 or 5.9% from $10.90 at September 30, 2024. At September 30, 2025, tangible book value per common share was negatively
affected by ($2.09) per share due to an accumulated other comprehensive loss of $37.8 million mostly due to changes in the market
value of the Company’s available for sale securities. At September 30, 2024, tangible book value per common share was negatively
affected by ($1.94) per share due to an accumulated other comprehensive loss of $38.0 million. The increases in the per share effect
of the accumulated other comprehensive loss reflected the reduction in the number of shares of Class A common stock outstanding
as a result of the share repurchases conducted in September 2025.
Conference Call and Webcast
The Company will host a conference call on Friday, October 24, 2025, at 11:00 a.m. Eastern Time to discuss the Company’s unaudited
financial results for the quarter ended September 30, 2025. To access the conference call, dial (833) 816-1416 (U.S. toll-free) and ask
to join the USCB Financial Holdings Call.
Additionally, interested parties can listen to a live webcast of the call in the “Investor Relations” section of the Company’s website
at www.uscentury.com . An archived version of the webcast will be available in the same location shortly after the live call has ended.
About USCB Financial Holdings, Inc.
USCB Financial Holdings, Inc. is the bank holding company for U.S. Century Bank. Established in 2002, U.S. Century Bank is one of
the largest community banks headquartered in Miami, and one of the largest community banks in the State of Florida. U.S. Century
Bank is rated 5-Stars by BauerFinancial, the nation’s leading independent bank rating firm. U.S. Century Bank offers customers a wide
range of financial products and services and supports numerous community organizations, including the Greater Miami Chamber of
Commerce, the South Florida Hispanic Chamber of Commerce, and ChamberSouth. For more information about us or to find a banking
center near you, please call (305) 715-5200 or visit www.uscentury.com.
3
Forward-Looking Statements
This earnings release may contain statements that are not historical in nature and are intended to be, and are hereby identified as, forward-
looking statements for purposes of the safe harbor provided by Section 21E of the Securities Exchange Act of 1934, as amended.
Forward-looking statements are those that are not historical facts. The words “may,” “will,” “anticipate,” “could,” “should,” “would,”
“believe,” “contemplate,” “expect,” “aim,” “plan,” “estimate,” “seek,” “continue,” and “intend,”, the negative of these terms, as well as
other similar words and expressions of the future, are intended to identify forward-looking statements. These forward-looking statements
include, but are not limited to, statements related to our projected growth, anticipated future financial performance, and management’s
long-term performance goals, as well as statements relating to the anticipated effects on our results of operations and financial condition
from expected or potential developments or events, or business and growth strategies, including anticipated internal growth and potential
balance sheet restructuring.
These forward-looking statements involve significant risks and uncertainties that could cause our actual results to differ materially from
those anticipated in such statements. Potential risks and uncertainties include, but are not limited to:
•
the strength of the United States economy in general and the strength of the local economies in which we conduct operations;
•
our ability to successfully manage interest rate risk, credit risk, liquidity risk, and other risks inherent to our industry;
•
the accuracy of our financial statement estimates and assumptions, including the estimates used for our credit loss reserve and
deferred tax asset valuation allowance;
•
the efficiency and effectiveness of our internal control procedures and processes;
•
our ability to comply with the extensive laws and regulations to which we are subject, including the laws for each jurisdiction where
we operate;
•
adverse changes or conditions in capital and financial markets, including actual or potential stresses in the banking industry;
•
deposit attrition and the level of our uninsured deposits;
•
legislative or regulatory changes, including the enactment of the Big Beautiful Bill and changes in accounting principles, policies,
practices or guidelines, including the on-going effects of the Current Expected Credit Losses (“CECL”) standard;
•
the lack of a significantly diversified loan portfolio and our concentration in the South Florida market, including the risks of
geographic, depositor, and industry concentrations, including our concentration in loans secured by real estate, in particular,
commercial real estate;
•
the effects of climate change;
•
the concentration of ownership of our common stock;
•
fluctuations in the price of our common stock;
•
our ability to fund or access the capital markets at attractive rates and terms and manage our growth, both organic growth as well
as growth through other means, such as future acquisitions;
•
inflation, interest rate, unemployment rate, and market and monetary fluctuations;
•
the effects of potential new or increased tariffs, retaliatory tariffs and trade restrictions;
•
the impact of international hostilities and geopolitical events;
•
increased competition and its effect on the pricing of our products and services as well as our interest rate spread and net interest
margin;
•
the loss of key employees;
•
the effectiveness of our risk management strategies, including operational risks, including, but not limited to, client, employee, or
third-party fraud and security breaches; and
•
other risks described in this earnings release and other filings we make with the Securities and Exchange Commission (“SEC”).
All forward-looking statements are necessarily only estimates of future results, and there can be no assurance that actual results will
not differ materially from expectations. Therefore, you are cautioned not to place undue reliance on any forward-looking statements.
Further, forward-looking statements included in this earnings release are made only as of the date hereof, and we undertake no obligation
to update or revise any forward-looking statement to reflect events or circumstances after the date on which the statements are made or
to reflect the occurrence of unanticipated events, unless required to do so under the federal securities laws. You should also review the
risk factors described in the reports the Company has filed or will file with the SEC.
Non-GAAP Financial Measures
This earnings release includes financial information determined by methods other than in accordance with generally accepted accounting
principles (“GAAP”). This financial information includes certain operating performance measures. Management has included these non-
GAAP measures because it believes these measures may provide useful supplemental information for evaluating the Company’s
operations and underlying performance trends. Further, management uses these measures in managing and evaluating the Company’s
business and intends to refer to them in discussions about our operations and performance. Operating performance measures should be
viewed in addition to, and not as an alternative to or substitute for, measures determined in accordance with GAAP, and are not
necessarily comparable to non-GAAP measures that may be presented by other companies. Reconciliations of these non-GAAP
4
measures to the most directly comparable GAAP measures can be found in the ‘Non-GAAP Reconciliation Tables’ included in the
exhibits to this earnings release.
All numbers included in this press release are unaudited unless otherwise noted.
Contacts:
Investor Relations
InvestorRelations@uscentury.com
Media Relations
Martha Guerra-Kattou
MGuerra@uscentury.com
5
USCB FINANCIAL HOLDINGS, INC.
CONSOLIDATED STATEMENTS OF INCOME (UNAUDITED)
(Dollars in thousands, except per share data)
Three Months Ended September 30,
Nine Months Ended September 30,
2025
2024
2025
2024
Interest income:
Loans, including fees
$
32,866
$
29,819
$
95,057
$
84,479
Investment securities
3,522
2,754
9,978
8,634
Interest-bearing deposits in financial institutions
1,332
989
2,817
3,953
Total interest income
37,720
33,562
107,852
97,066
Interest expense:
Interest-bearing checking deposits
286
411
909
1,171
Savings and money market deposits
10,343
10,064
29,088
30,529
Time deposits
5,036
3,391
13,297
9,907
FHLB advances
377
1,587
2,731
4,881
Subordinated notes
404
-
404
-
Total interest expense
16,446
15,453
46,429
46,488
Net interest income before provision for credit losses
21,274
18,109
61,423
50,578
Provision for credit losses
105
931
1,817
2,127
Net interest income after provision for credit losses
21,169
17,178
59,606
48,451
Non-interest income:
Service fees
2,661
2,544
7,394
6,172
(Loss) gain on sale of securities available for sale, net
(28)
-
(28)
14
Gain on sale of loans held for sale, net
128
109
804
593
Other non-interest income
923
785
2,600
2,334
Total non-interest income
3,684
3,438
10,770
9,113
Non-interest expense:
Salaries and employee benefits
7,909
7,200
23,499
20,863
Occupancy
1,382
1,341
4,003
3,921
Regulatory assessments and fees
377
452
1,194
1,361
Consulting and legal fees
585
161
1,041
1,016
Network and information technology services
656
513
1,725
1,499
Other operating expense
2,139
1,787
6,272
5,528
Total non-interest expense
13,048
11,454
37,734
34,188
Net income before income tax expense
11,805
9,162
32,642
23,376
Income tax expense
2,866
2,213
7,905
5,606
Net income
$
8,939
$
6,949
$
24,737
$
17,770
Per share information:
Net income per common share, basic
$
0.46
$
0.35
$
1.25
$
0.90
Net income per common share, diluted
$
0.45
$
0.35
$
1.23
$
0.90
Cash dividends declared
$
0.10
$
0.05
$
0.30
$
0.15
Weighted average shares outstanding:
Common shares, basic
19,524,798
19,621,447
19,866,514
19,653,103
Common shares, diluted
19,755,820
19,825,211
20,106,050
19,761,242
6
USCB FINANCIAL HOLDINGS, INC.
SELECTED FINANCIAL DATA (UNAUDITED)
(Dollars in thousands, except per share data)
As of or For the Three Months Ended
9/30/2025
6/30/2025
3/31/2025
12/31/2024
9/30/2024
Income statement data:
Net interest income before provision for credit losses
$
21,274
$
21,034
$
19,115
$
19,358
$
18,109
Provision for credit losses
105
1,031
681
1,030
931
Net interest income after provision for credit losses
21,169
20,003
18,434
18,328
17,178
Service fees
2,661
2,402
2,331
2,667
2,544
Loss on sale of securities available for sale, net
(28)
-
-
-
-
Gain on sale of loans held for sale, net
128
151
525
154
109
Other non-interest income
923
817
860
806
785
Total non-interest income
3,684
3,370
3,716
3,627
3,438
Salaries and employee benefits
7,909
7,954
7,636
7,930
7,200
Occupancy
1,382
1,337
1,284
1,337
1,341
Regulatory assessments and fees
377
396
421
405
452
Consulting and legal fees
585
263
193
552
161
Network and information technology services
656
564
505
494
513
Other operating expense
2,139
2,120
2,013
2,136
1,787
Total non-interest expense
13,048
12,634
12,052
12,854
11,454
Net income before income tax expense
11,805
10,739
10,098
9,101
9,162
Income tax expense
2,866
2,599
2,440
2,197
2,213
Net income
$
8,939
$
8,140
$
7,658
$
6,904
$
6,949
Per share information:
Net income per common share, basic
$
0.46
$
0.41
$
0.38
$
0.35
$
0.35
Net income per common share, diluted
$
0.45
$
0.40
$
0.38
$
0.34
$
0.35
Cash dividends declared
$
0.10
$
0.10
$
0.10
$
0.05
$
0.05
Balance sheet data (at period-end):
Cash and cash equivalents
$
56,811
$
54,819
$
97,984
$
77,035
$
38,486
Securities available-for-sale
$
324,179
$
285,382
$
275,139
$
260,221
$
259,527
Securities held-to-maturity
$
156,365
$
158,740
$
161,790
$
164,694
$
167,001
Total securities
$
480,544
$
444,122
$
436,929
$
424,915
$
426,528
Loans held for investment
(1)
$
2,130,966
$
2,113,318
$
2,036,212
$
1,972,848
$
1,931,362
Allowance for credit losses
$
(24,964)
$
(24,933)
$
(24,740)
$
(24,070)
$
(23,067)
Total assets
$
2,767,945
$
2,719,474
$
2,677,382
$
2,581,216
$
2,503,954
Non-interest-bearing demand deposits
$
584,240
$
584,895
$
605,489
$
575,159
$
637,313
Interest-bearing deposits
$
1,871,374
$
1,750,766
$
1,704,080
$
1,598,845
$
1,489,304
Total deposits
$
2,455,614
$
2,335,661
$
2,309,569
$
2,174,004
$
2,126,617
FHLB advances
$
11,000
$
108,000
$
108,000
$
163,000
$
118,000
Subordinated notes
$
39,262
$
-
$
-
$
-
$
-
Total liabilities
$
2,558,850
$
2,487,891
$
2,452,294
$
2,365,828
$
2,290,038
Total stockholders' equity
$
209,095
$
231,583
$
225,088
$
215,388
$
213,916
Capital ratios:
(2)
Leverage ratio
8.47%
9.72%
9.61%
9.53%
9.34%
Common equity tier 1 capital
11.17%
12.52%
12.48%
12.28%
12.01%
Tier 1 risk-based capital
11.17%
12.52%
12.48%
12.28%
12.01%
Total risk-based capital
14.20%
13.73%
13.72%
13.51%
13.22%
(1) Loan amounts include deferred fees/costs.
(2) Reflects the Company's regulatory capital ratios which are provided for informational purposes only; as a small bank holding company, the Company is not subject
to regulatory capital requirements. The Bank's total risk-based capital at September 30, 2025 was 13.93%.
7
USCB FINANCIAL HOLDINGS, INC.
AVERAGE BALANCES, RATIOS, AND OTHER DATA (UNAUDITED)
(Dollars in thousands)
As of or For the Three Months Ended
9/30/2025
6/30/2025
3/31/2025
12/31/2024
9/30/2024
Average balance sheet data:
Cash and cash equivalents
$
139,389
$
71,388
$
82,610
$
56,937
$
87,937
Securities available-for-sale
$
299,892
$
281,840
$
265,154
$
255,786
$
244,882
Securities held-to-maturity
$
157,702
$
160,443
$
163,510
$
165,831
$
168,632
Total securities
$
457,594
$
442,283
$
428,664
$
421,617
$
413,514
Loans held for investment
(1)
$
2,099,043
$
2,057,445
$
1,986,856
$
1,958,566
$
1,878,230
Total assets
$
2,798,115
$
2,677,198
$
2,606,593
$
2,544,592
$
2,485,434
Interest-bearing deposits
$
1,887,545
$
1,710,568
$
1,652,147
$
1,547,789
$
1,468,067
Non-interest-bearing demand deposits
$
569,522
$
580,121
$
563,040
$
590,829
$
609,456
Total deposits
$
2,457,067
$
2,290,689
$
2,215,187
$
2,138,618
$
2,077,523
FHLB advances
$
40,065
$
116,527
$
138,944
$
151,804
$
156,043
Subordinated notes
$
26,029
$
-
$
-
$
-
$
-
Total liabilities
$
2,572,799
$
2,448,706
$
2,387,088
$
2,328,877
$
2,278,793
Total stockholders' equity
$
225,316
$
228,492
$
219,505
$
215,715
$
206,641
Performance ratios:
Return on average assets
(2)
1.27%
1.22%
1.19%
1.08%
1.11%
Return on average equity
(2)
15.74%
14.29%
14.15%
12.73%
13.38%
Net interest margin
(2)
3.14%
3.28%
3.10%
3.16%
3.03%
Non-interest income to average assets
(2)
0.52%
0.50%
0.58%
0.57%
0.55%
Non-interest expense to average assets
(2)
1.85%
1.89%
1.88%
2.01%
1.83%
Efficiency ratio
(3)
52.28%
51.77%
52.79%
55.92%
53.16%
Loans by type (at period end):
(4)
Residential real estate
$
316,557
$
307,020
$
301,164
$
289,961
$
283,477
Commercial real estate
$
1,226,121
$
1,206,621
$
1,150,129
$
1,136,417
$
1,095,112
Commercial and industrial
$
269,430
$
263,966
$
256,326
$
258,311
$
246,539
Correspondent banks
$
104,598
$
110,155
$
103,026
$
82,438
$
103,815
Consumer and other
$
207,939
$
218,426
$
218,711
$
198,091
$
198,604
Asset quality data:
Allowance for credit losses to total loans
1.17%
1.18%
1.22%
1.22%
1.19%
Allowance for credit losses to non-performing loans
1906%
1825%
595%
889%
846%
Total non-performing loans
(5)
$
1,310
$
1,366
$
4,156
$
2,707
$
2,725
Non-performing loans to total loans
0.06%
0.06%
0.20%
0.14%
0.14%
Non-performing assets to total assets
(5)
0.05%
0.05%
0.16%
0.10%
0.11%
Net charge-offs (recoveries of) to average loans
(2)
(0.00)%
0.14%
0.00%
(0.00)%
(0.00)%
Net charge-offs (recovery) of credit losses
$
(4)
$
702
$
2
$
(11)
$
(6)
Interest rates and yields:
(2)
Loans held for investment
6.21%
6.23%
6.17%
6.25%
6.32%
Investment securities
3.03%
3.06%
2.81%
2.63%
2.61%
Total interest-earning assets
5.56%
5.64%
5.51%
5.57%
5.61%
Deposits
(6)
2.53%
2.46%
2.49%
2.48%
2.66%
FHLB advances
3.73%
3.72%
3.71%
3.81%
4.05%
Subordinated notes
6.16%
-
-
-
-
Total interest-bearing liabilities
3.34%
3.32%
3.37%
3.47%
3.79%
Other information:
Full-time equivalent employees
206
203
201
199
198
(1) Loan amounts include deferred fees/costs.
(2) Annualized.
(3) Efficiency ratio is defined as total non-interest expense divided by sum of net interest income and total non-interest income.
(4) Loan amounts exclude deferred fees/costs.
(5) The amounts for total non-performing loans and total non-performing assets are the same at the dates presented since there was no other real estate owned (OREO)
recorded at any of the dates presented.
(6) Reflects effect of non-interest-bearing deposits.
8
USCB FINANCIAL HOLDINGS, INC.
NET INTEREST MARGIN (UNAUDITED)
(Dollars in thousands)
Three Months Ended September 30,
2025
2024
Average
Balance
Interest
Yield/Rate
(1)
Average
Balance
Interest
Yield/Rate
(1)
Assets
Interest-earning assets:
Loans held for investment
(2)
$
2,099,043
$
32,866
6.21%
$
1,878,230
$
29,819
6.32%
Investment securities
(3)
461,303
3,522
3.03%
419,315
2,754
2.61%
Other interest-earning assets
130,740
1,332
4.04%
80,378
989
4.89%
Total interest-earning assets
2,691,086
37,720
5.56%
2,377,923
33,562
5.61%
Non-interest-earning assets
107,029
107,511
Total assets
$
2,798,115
$
2,485,434
Liabilities and stockholders' equity
Interest-bearing liabilities:
Interest-bearing checking deposits
$
47,338
286
2.40%
$
57,925
411
2.82%
Saving and money market deposits
1,319,862
10,343
3.11%
1,084,562
10,064
3.69%
Time deposits
520,345
5,036
3.84%
325,580
3,391
4.14%
Total interest-bearing deposits
1,887,545
15,665
3.29%
1,468,067
13,866
3.76%
FHLB advances
40,065
377
3.73%
156,043
1,587
4.05%
Subordinated notes
26,029
404
6.16%
-
-
- %
Total interest-bearing liabilities
1,953,639
16,446
3.34%
1,624,110
15,453
3.79%
Non-interest-bearing demand deposits
569,522
609,456
Other non-interest-bearing liabilities
49,638
45,227
Total liabilities
2,572,799
2,278,793
Stockholders' equity
225,316
206,641
Total liabilities and stockholders' equity
$
2,798,115
$
2,485,434
Net interest income
21,274
18,109
Net interest spread
(4)
2.22%
1.82%
Net interest margin
(5)
3.14%
3.03%
(1) Annualized.
(2) Average loan balances include non-accrual loans. Interest income on loans includes accretion of deferred loan fees, net of deferred loan costs.
(3) At fair value except for securities held to maturity. This amount includes FHLB stock.
(4) Net interest spread is the average yield earned on total interest-earning assets minus the average rate paid on total interest-bearing liabilities.
(5) Net interest margin is the ratio of net interest income to total interest-earning assets.
9
USCB FINANCIAL HOLDINGS, INC.
NON-GAAP FINANCIAL MEASURES (UNAUDITED)
(Dollars in thousands)
As of or For the Three Months Ended
9/30/2025
6/30/2025
3/31/2025
12/31/2024
9/30/2024
Pre-tax pre-provision ("PTPP") income:
(1)
Net income
$
8,939
$
8,140
$
7,658
$
6,904
$
6,949
Plus: Income tax expense
2,866
2,599
2,440
2,197
2,213
Plus: Provision for credit losses
105
1,031
681
1,030
931
PTPP income
$
11,910
$
11,770
$
10,779
$
10,131
$
10,093
PTPP return on average assets:
(1)
PTPP income
$
11,910
$
11,770
$
10,779
$
10,131
$
10,093
Average assets
$
2,798,115
$
2,677,198
$
2,606,593
$
2,544,592
$
2,485,434
PTPP return on average assets
(2)
1.69%
1.76%
1.68%
1.58%
1.62%
Operating net income:
(1)
Net income
$
8,939
$
8,140
$
7,658
$
6,904
$
6,949
Less: Net losses on sale of securities
(28)
-
-
-
-
Less: Tax effect on sale of securities
7
-
-
-
-
Operating net income
$
8,960
$
8,140
$
7,658
$
6,904
$
6,949
Operating PTPP income:
(1)
PTPP income
$
11,910
$
11,770
$
10,779
$
10,131
$
10,093
Less: Net losses on sale of securities
(28)
-
-
-
-
Operating PTPP income
$
11,938
$
11,770
$
10,779
$
10,131
$
10,093
Operating PTPP return on average assets:
(1)
Operating PTPP income
$
11,938
$
11,770
$
10,779
$
10,131
$
10,093
Average assets
$
2,798,115
$
2,677,198
$
2,606,593
$
2,544,592
$
2,485,434
Operating PTPP return on average assets
(2)
1.69%
1.76%
1.68%
1.58%
1.62%
Operating return on average assets:
(1)
Operating net income
$
8,960
$
8,140
$
7,658
$
6,904
$
6,949
Average assets
$
2,798,115
$
2,677,198
$
2,606,593
$
2,544,592
$
2,485,434
Operating return on average assets
(2)
1.27%
1.22%
1.19%
1.08%
1.11%
Operating return on average equity:
(1)
Operating net income
$
8,960
$
8,140
$
7,658
$
6,904
$
6,949
Average equity
$
225,316
$
228,492
$
219,505
$
215,715
$
206,641
Operating return on average equity
(2)
15.78%
14.29%
14.15%
12.73%
13.38%
Operating Revenue:
(1)
$
21,274
$
21,034
$
19,115
$
19,358
$
18,109
3,684
3,370
3,716
3,627
3,438
(28)
-
-
-
-
$
24,986
$
24,404
$
22,831
$
22,985
$
21,547
Operating Efficiency Ratio:
(1)
$
13,048
$
12,634
$
12,052
$
12,854
$
11,454
$
24,986
$
24,404
$
22,831
$
22,985
$
21,547
52.22%
51.77%
52.79%
55.92%
53.16%
(1) The Company believes these non-GAAP measurements are key indicators of the ongoing earnings power of the Company.
(2) Annualized.
10
USCB FINANCIAL HOLDINGS, INC.
NON-GAAP FINANCIAL MEASURES (UNAUDITED)
(Dollars in thousands, except per share data)
As of or For the Three Months Ended
9/30/2025
6/30/2025
3/31/2025
12/31/2024
9/30/2024
Tangible book value per common share (at period-end):
(1)
Total stockholders' equity
$
209,095
$
231,583
$
225,088
$
215,388
$
213,916
Less: Intangible assets
-
-
-
-
-
Tangible stockholders' equity
$
209,095
$
231,583
$
225,088
$
215,388
$
213,916
Total shares issued and outstanding (at period-end):
Total common shares issued and outstanding
18,107,385
20,078,385
20,048,385
19,924,632
19,620,632
Tangible book value per common share
(2)
$
11.55
$
11.53
$
11.23
$
10.81
$
10.90
Operating diluted net income per common share:
(1)
Operating net income
$
8,960
$
8,140
$
7,658
$
6,904
$
6,949
Total weighted average diluted shares of common stock
19,755,820
20,295,794
20,319,535
20,183,731
19,825,211
Operating diluted net income per common share:
$
0.45
$
0.40
0.38
0.34
0.35
Tangible Common Equity/Tangible Assets
(1)
$
209,095
$
231,583
$
225,088
$
215,388
$
213,916
(3)
$
2,767,945
2,719,474
2,677,382
2,581,216
2,503,954
Tangible Common Equity/Tangible Assets
7.55%
8.52%
8.41%
8.34%
8.54%
(1) The Company believes these non-GAAP measurements are key indicators of the ongoing earnings power of the Company.
(2) Excludes the dilutive effect, if any, of shares of common stock issuable upon exercise of outstanding stock options.
(3) Since the Company has no intangible assets, tangible stockholders’ equity and tangible total assets are the same amounts as stockholders’ equity and total assets,
respectively, as calculated under GAAP.
Exhibit 99.2
USCB FINANCIAL HOLDINGS EARNINGS PRESENTATION THIRD QUARTER 2025 NASDAQ: USCB
FORWARD-LOOKING STATEMENTS This presentation may contain statements that are not historical in nature and are intended to be, and are hereby identified as, forward-looking statements for purposes of the safe harbor provided by Section 21E of the Securities Exchange Act of 1934, as amended. Forward-looking statements are those that are not historical facts. The words “may,” “will,” “anticipate,” “could,” “ should,” “would,” “believe,” “contemplate,” “expect,” “aim,” “plan,” “estimate,” “continue,” “seek,” and “intend,” the negative of these terms, as well as other similar words and expressions of the future, are intended to identify forward-looking statements. These forward-looking statements include, but are not limited to, statements related to our projected growth, anticipated future financial performance, and management’s long-term performance goals, as well as statements relating to the anticipated effects on our results of operations and financial condition from expected or potential developments or events, or business and growth strategies, including anticipated internal growth and potential balance sheet restructuring. All numbers included in this presentation are unaudited unless otherwise noted. These forward-looking statements involve significant risks and uncertainties that could cause our actual results to differ materially from those anticipated in such statements. Potential risks and uncertainties include, but are not limited to: the strength of the United States economy in general and the strength of the local economies in which we conduct operations; our ability to successfully manage interest rate risk, credit risk, liquidity risk, and other risks inherent to our industry; the accuracy of our financial statement estimates and assumptions, including the estimates used for our allowance for credit losses and deferred tax asset valuation allowance; the efficiency and effectiveness of our internal
control procedures and processes; our ability to comply with the extensive laws and regulations to which we are subject, including the laws for each jurisdiction where we operate; adverse changes or conditions in the capital and financial markets, including actual or potential stresses in the banking industry; deposit attrition and the level of our uninsured deposits; legislative or regulatory changes and changes, including the enactment of the One Big Beautiful Bill, in accounting principles, policies, practices or guidelines, including the on-going effects of the implementation of the Current Expected Credit Losses (“CECL”) standard; the lack of a significantly diversified loan portfolio and our concentration in the South Florida market, including the risks of geographic, depositor, and industry concentrations, including our concentration in loans secured by real estate, in particular, commercial real estate; the effects of climate change; the concentration of ownership of our common stock; fluctuations in the price of our common stock; our ability to fund or access the capital markets at attractive rates and terms and manage our growth, both organic growth as well as growth through other means, such as future acquisitions; inflation, interest rate, unemployment rate, and market and monetary fluctuations; the effects of potential new or increased tariffs, retaliation tariffs and trade restrictions; the impact of international hostilities and geopolitical events; increased competition and its effect on the pricing of our products and services as well as our net interest rate spread and net interest margin; the loss of key employees; the effectiveness of our risk management strategies, including operational risks, including, but not limited to, client, employee, or third-party fraud and security breaches; and other risks described in this presentation and other filings we make with the Securities and Exchange Commission (“SEC”). All
forward-looking statements are necessarily only estimates of future results, and there can be no assurance that actual results will not differ materially from expectations. Therefore, you are cautioned not to place undue reliance on any forward-looking statements. Further, forward-looking statements included in this presentation are made only as of the date hereof, and we undertake no obligation to update or revise any forward-looking statements to reflect events or circumstances occurring after the date on which the statements are made or to reflect the occurrence of unanticipated events, unless required to do so under the federal securities laws. You should also review the risk factors described in the reports USCB Financial Holdings, Inc. has filed or will file with the SEC. Non-GAAP Financial Measures This presentation includes financial information determined by methods other than in accordance with generally accepted accounting principles (“GAAP”). This financial information includes certain operating performance measures. Management has included these non-GAAP financial measures because it believes these measures may provide useful supplemental information for evaluating the Company’s expectations and underlying performance trends. Further, management uses these measures in managing and evaluating the Company’s business and intends to refer to them in discussions about our operations and performance. Operating performance measures should be viewed in addition to, and not as an alternative to or substitute for, measures determined in accordance with GAAP, and are not necessarily comparable to non-GAAP measures that may be presented by other companies. Reconciliations of these non-GAAP measures to the most directly comparable GAAP measures can be found in the Non-GAAP financial measures reconciliation tables included in this presentation. 2
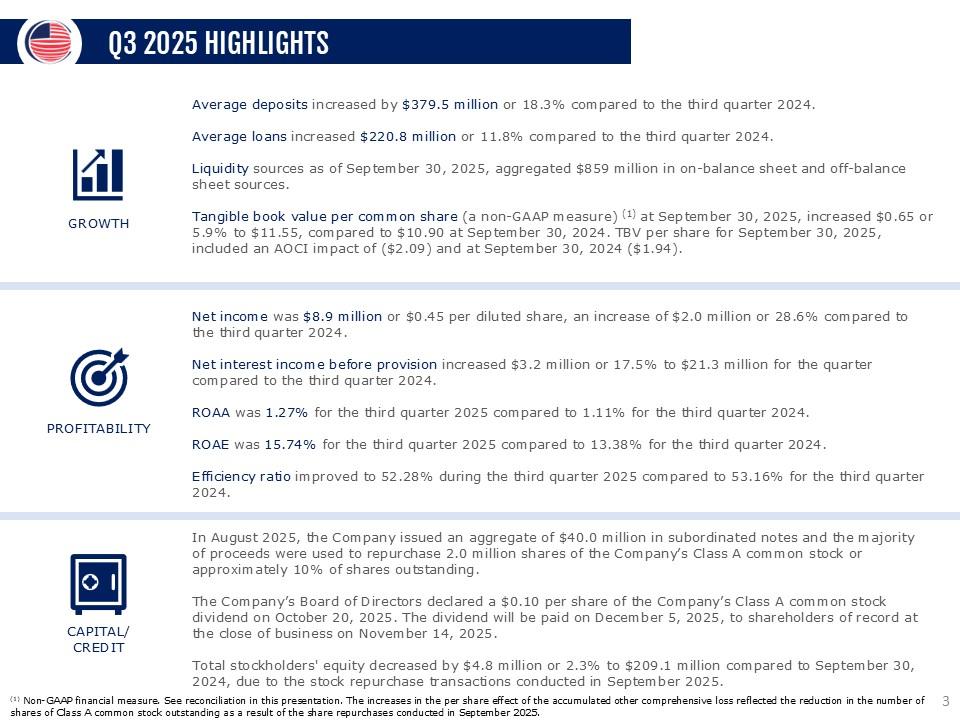
Q3 2025 HIGHLIGHTS Growth Average deposits increased by $379.5 million or 18.3% compared to the third quarter 2024. Average loans increased $220.8 million or 11.8% compared to the third quarter 2024. Liquidity sources as of September 30, 2025, aggregated $859 million in on-balance sheet and off-balance sheet sources. Tangible book value per common share (a non-GAAP measure) (1) at September 30, 2025, increased $0.65 or 5.9% to $11.55, compared to $10.90 at September 30, 2024. TBV per share for September 30, 2025, included an AOCI impact of ($2.09) and at September 30, 2024 ($1.94). Profitability Net income was $8.9 million or $0.45 per diluted share, an increase of $2.0 million or 28.6% compared to the third quarter 2024. Net interest income before provision increased $3.2 million or 17.5% to $21.3 million for the quarter compared to the third quarter 2024. ROAA was 1.27% for the third quarter 2025 compared to 1.11% for the third quarter 2024. ROAE was 15.74% for the third quarter 2025 compared to 13.38% for the third quarter 2024. Efficiency ratio improved to 52.28% during the third quarter 2025 compared to 53.16% for the third quarter 2024. CAPITAL/CREDIT In August 2025, the Company issued an aggregate of $40.0 million in subordinated notes and the majority of proceeds were used to repurchase 2.0 million shares of the Company’s Class A common stock or approximately 10% of shares outstanding. The Company’s Board of Directors declared a $0.10 per share of the Company’s Class A common stock dividend on October 20, 2025. The dividend will be paid on December 5, 2025, to shareholders of record at the close of business on November 14, 2025. Total stockholders' equity decreased by $4.8 million or 2.3% to $209.1 million compared to September 30, 2024, due to the stock repurchase transactions conducted in September 2025. (1) Non-GAAP
financial measure. See reconciliation in this presentation. The increases in the per share effect of the accumulated other comprehensive loss reflected the reduction in the number of shares of Class A common stock outstanding as a result of the share repurchases conducted in September 2025. 3
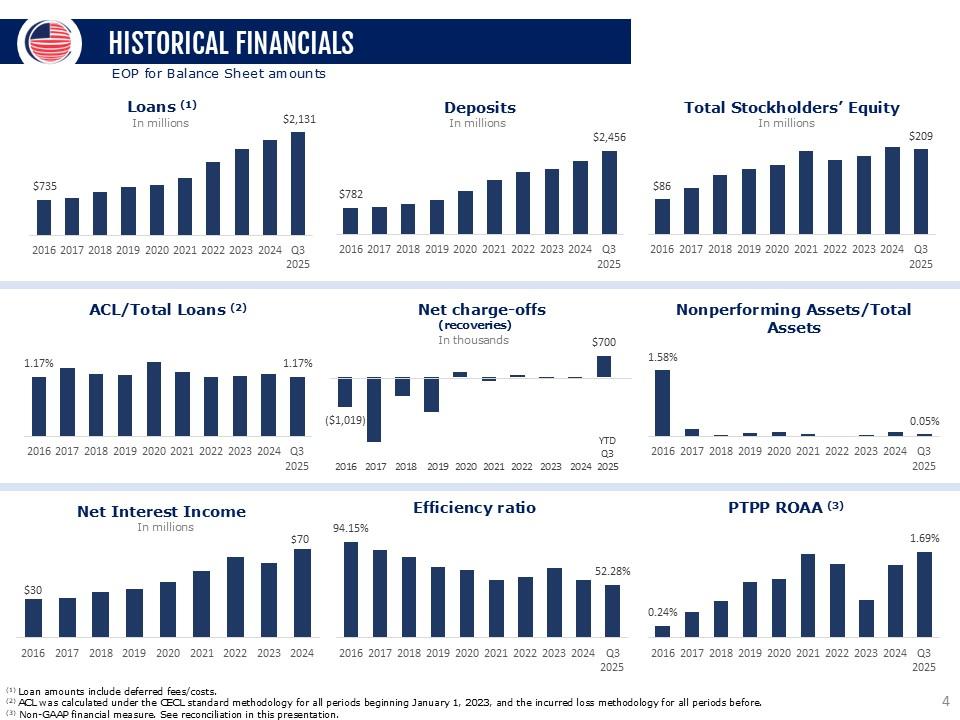
HISTORICAL FINANCIALS EOP for Balance Sheet amounts Loans In millions $735 $2,131 2016 2017 2018 2019 2020 2021 2022 2023 2024 Q3 2025 Deposits In millions $782 $2,456 2016 2017 2018 2019 2020 2021 2022 2023 2024 Q3 2025 Total Stockholders’ Equity In millions $86 $209 2016 2017 2018 2019 2020 2021 2022 2023 2024 Q3 2025 ACL/Total Loans 1.17% 1.17% 2016 2017 2018 2019 2020 2021 2022 2023 2024 Q3 2025 Net charge -offs (recoveries) In thousands ($1,019) $700 2016 2017 2018 2019 2020 2021 2022 2023 2024 Q3 2025 Nonperforming Assets/Total Assets 1.58% 0.05% 2016 2017 2018 2019 2020 2021 2022 2023 2024 Q3 2025 Net Interest Income In millions $30 $70 2016 2017 2018 2019 2020 2021 2022 2023 2024 Q3 2025 Efficiency Ratio 94.15% 52.28% 2016 2017 2018 2019 2020 2021 2022 2023 2024 Q3 2025 PTPP ROAA 0.24% 1.69% 2016 2017 2018 2019 2020 2021 2022 2023 2024 Q3 2025 (1) Loan amounts include deferred fees/costs. (2) ACL was calculated under the CECL standard methodology for all periods beginning January 1, 2023, and the incur red loss methodology for all periods before. (3) Non-GAAP financial measure. See reconciliation in this presentation. 4
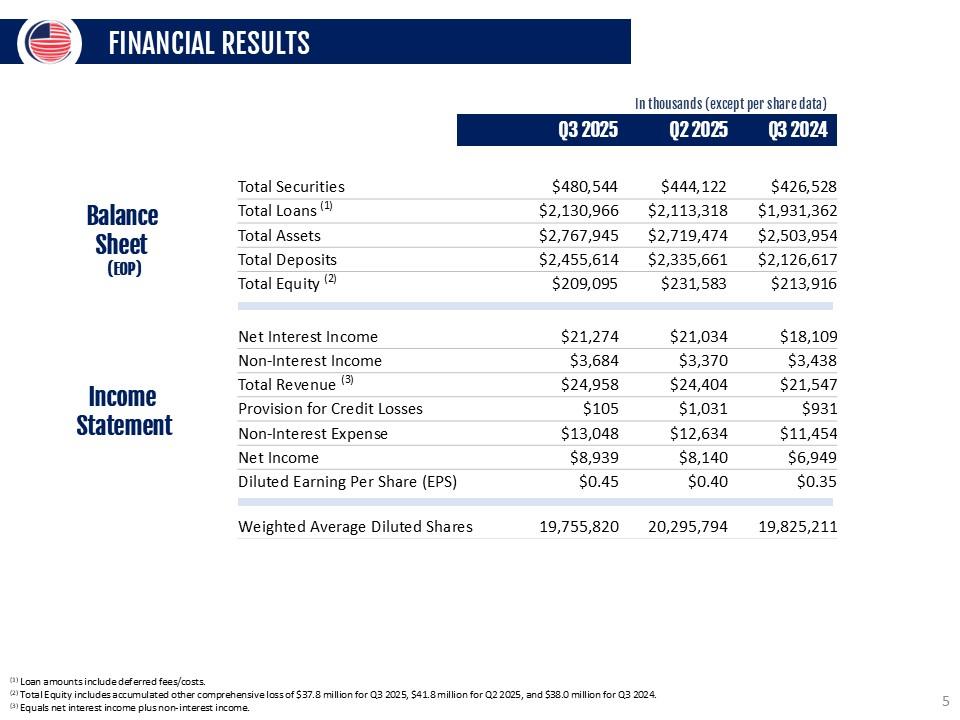
FINANCIAL RESULTS In thousands (except per share data) Q3 2025 Q2 2025 Q3 2024 Balance Sheet (EOP) Total Securities $480,544 $444,122 $426,528 Total Loans (1) $2,130,966 $2,113,318 $1,931,362 Total Assets $2,767,945 $2,719,474 $2,503,954 Total Deposits $2,455,614 $2,335,661 $2,126,617 Total Equity (2) $209,095 $231,583 $213,916 Income Statement Net Interest Income $21,274 $21,034 $18,109 Non-Interest Income $3,684 $3,370 $3,438 Total Revenue (3) $24,958 $24,404 $21,547 Provision for Credit Losses $105 $1,031 $931 Non-Interest Expense $13,048 $12,634 $11,454 Net Income $8,939 $8,140 $6,949 Diluted Earning Per Share (EPS) $0.45 $0.40 $0.35 Weighted Average Diluted Shares 19,755,820 20,295,794 19,825,211 (1) Loan amounts include deferred fees/costs. (2) Total Equity includes accumulated other comprehensive loss of $37.8 million for Q3 2025, $41.8 million for Q2 2025, and $38.0 million for Q3 2024. (3) Equals net interest income plus non-interest income. 5
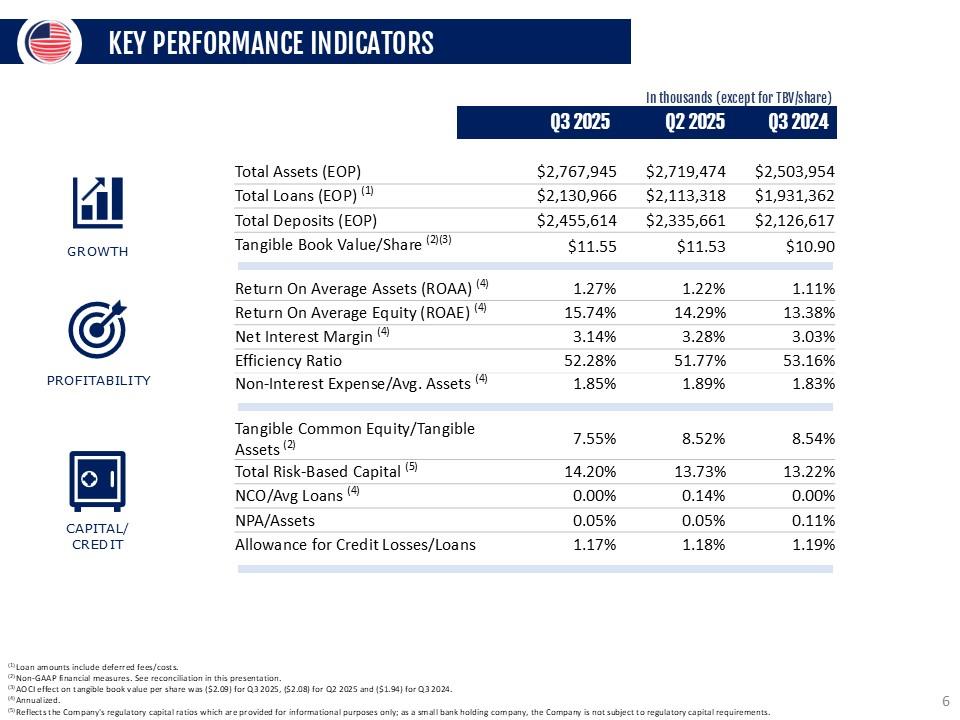
KEY PERFORMANCE INDICATORS In thousands (except for TBV/share) Q3 2025 Q2 2025 Q3 2024 Growth Total Assets (EOP) $2,767,945 $2,719,474 $2,503,954 Total Loans (EOP) (1) $2,130,966 $2,113,318 $1,931,362 Total Deposits (EOP) $2,455,614 $2,335,661 $2,126,617 Tangible Book Value/Share (2)(3) $11.55 $11.53 $10.90 PROFITABILITY Return On Average Assets (ROAA) (4) 1.27% 1.22% 1.11% Return On Average Equity (ROAE) (4) 15.74% 14.29% 13.38% Net Interest Margin (4) 3.14% 3.28% 3.03% Efficiency Ratio 52.28% 51.77% 53.16% Non-Interest Expense/Avg. Assets (4) 1.85% 1.89% 1.83% CAPITAL/CREDIT Tangible Common Equity/Tangible Assets (2) 7.55% 8.52% 8.54% Total Risk-Based Capital (5) 14.20% 13.73% 13.22% NCO/Avg Loans (4) 0.00% 0.14% 0.00% NPA/Assets 0.05% 0.05% 0.11% Allowance for Credit Losses/Loans 1.17% 1.18% 1.19% (1) Loan amounts include deferred fees/costs. (2) Non-GAAP financial measures. See reconciliation in this presentation. (3) AOCI effect on tangible book value per share was ($2.09) for Q3 2025, ($2.08) for Q2 2025 and ($1.94) for Q3 2024. (4) Annualized. (5) Reflects the Company's regulatory capital ratios which are provided for informational purposes only; as a small bank holding company, the Company is not subject to regulatory capital requirements. 6
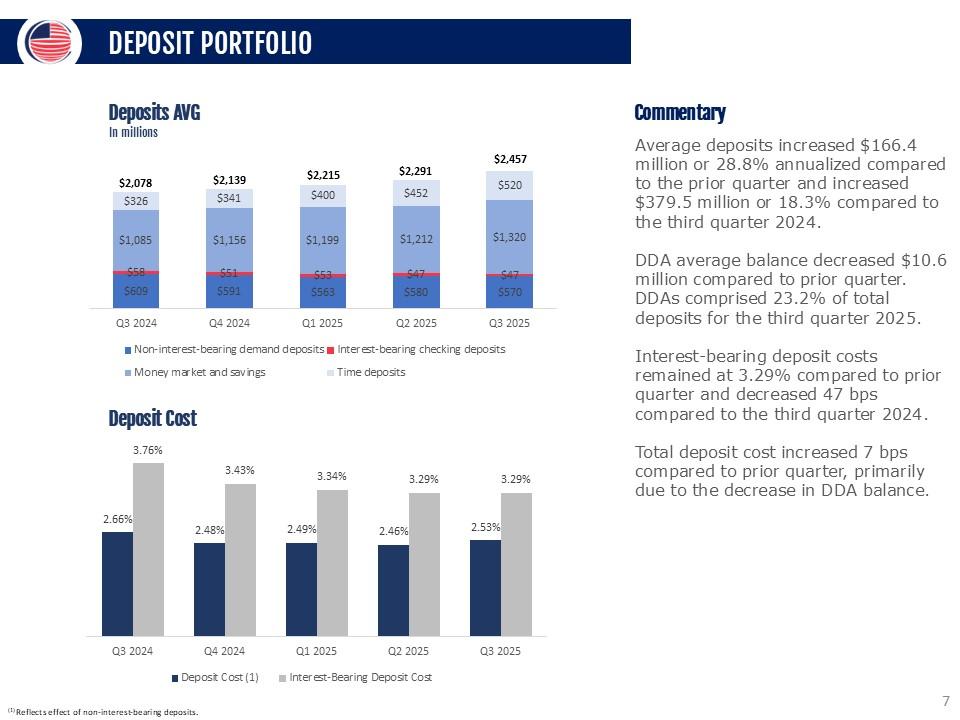
DEPOSIT PORTFOLIO Deposits AVG In millions $2,078 $2,139 $2,215 $2,291 $2,457 $326 $341 $400 $452 $520 $1,085 $1,156 $1,199 $1,212 $1,320 $56 $51 $53 $47 $609 $591 $563 $580 $570 Q3 2024 Q4 2024 Q1 2025 Q2 2025 Q3 2025 Non-interest-bearing demand deposits Interest-bearing checking deposits Money market and savings Time deposits Deposit cost 2.66% 3.76% 2.48% 3.43% 2.49% 3.34% 2.46% 3.29% 2.53% 3.29 Q3 2024 Q4 2024 Q1 2025 Q2 2025 Q3 2025 Deposit Cost Interest-Bearing Deposit Cost Commentary Average deposits increased $166.4 million or 28.8% annualized compared to the prior quarter and increased $379.5 million or 18.3% compared to the third quarter 2024. DDA average balance decreased $10.6 million compared to prior quarter. DDAs comprised 23.2% of total deposits for the third quarter 2025. Interest-bearing deposit costs remained at 3.29% compared to prior quarter and decreased 47 bps compared to the third quarter 2024. Total deposit cost increased 7 bps compared to prior quarter, primarily due to the decrease in DDA balance. (1) Reflects effect of non-interest-bearing deposits. 7
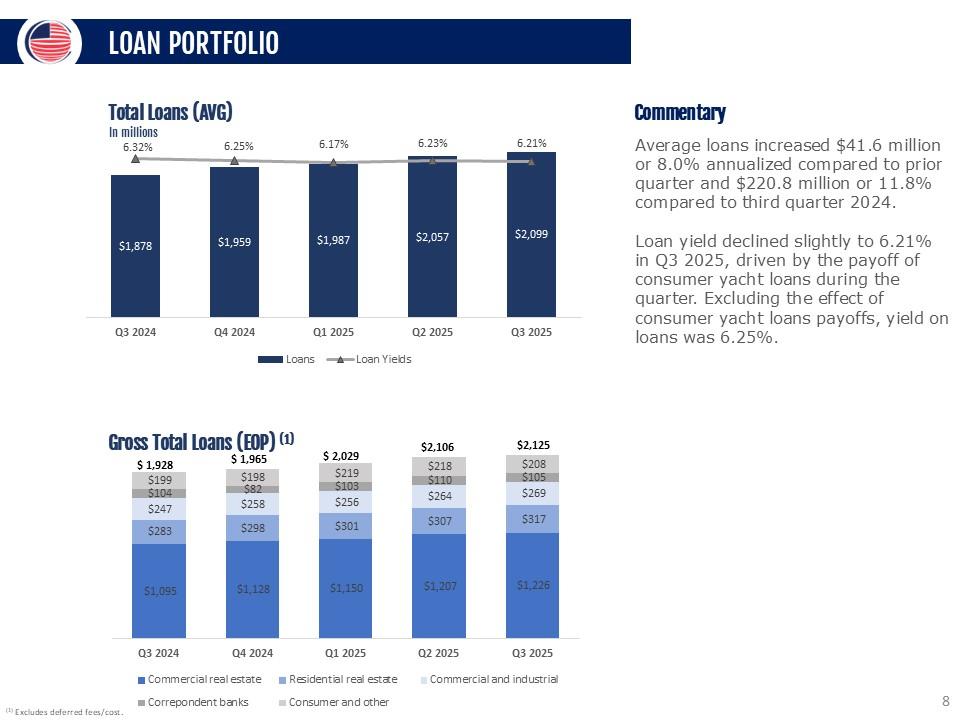
LOAN PORTFOLIO Total Loans (AVG) In millions 6.32% 6.25% 6.17`% 6.23% 6.21% $1,878 $1,959 $1,987 $2,057 $2,099 Q3 2024 Q4 2024 Q1 2025 Q2 2025 Q3 2025 Loans Loan Yields Gross total Loans (EOP) $1,928 $1,965 $2,029 $2,106 $2,125 $199 $198 $219 $218 $208 $104 $82 $103 $110 $105 $247 $258 $256 $264 $269 $283 $298 $301 $307 $317 $1,095 $1,128 $1,150 $1,207 $1,226 Q3 2024 Q4 2024 Q1 2025 Q2 2025 Q3 2025 Commercial real estate Residential real estate Commercial and industrial Correspondent banks Consumer and other Commentary Average loans increased $41.6 million or 8.0% annualized compared to prior quarter and $220.8 million or 11.8% compared to third quarter 2024. Loan yield declined slightly to 6.21% in Q3 2025, driven by the payoff of consumer yacht loans during the quarter. Excluding the effect of consumer yacht loans payoffs, yield on loans was 6.25%. (1) Excludes deferred fees/cost. 8
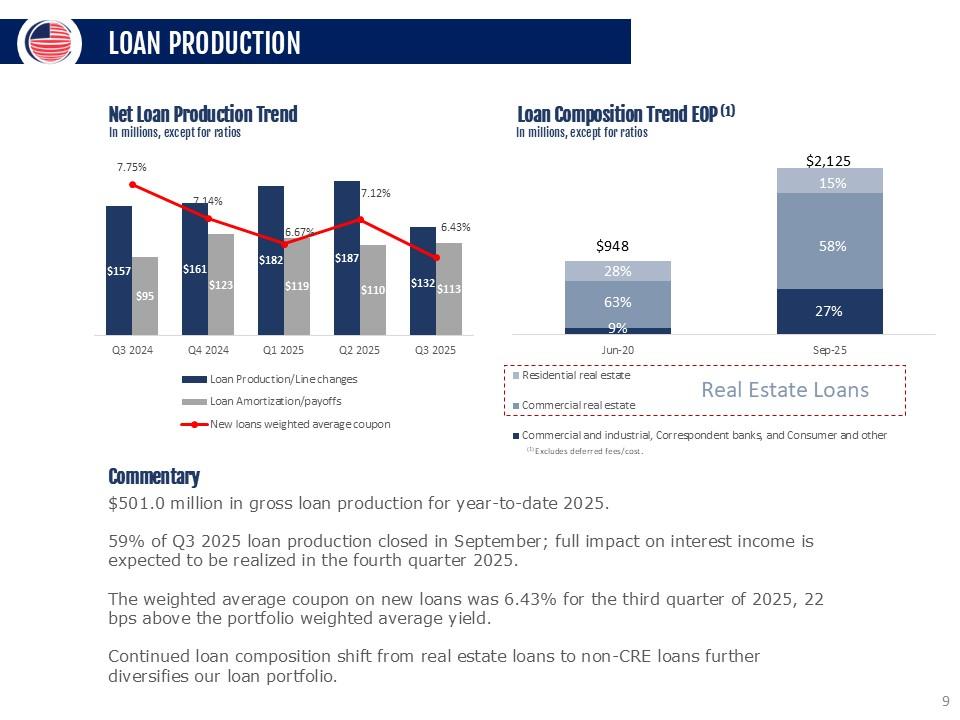
LOAN PRODUCTION Net Loan Production Trend In millions, except for ratios 7.75% 7.14% 6.67% 7.12% 6.43% $157 $95 $161 $123 $182 $119 $187 $110 $132 113 Q3 2024 Q4 2024 Q1 2025 Q2 2025 Q3 2025 Loan Production/Line Changes Loan Amortization/payoffs New loans weighted average coupon Loan Composition Trend EOP (1) In millions, except for ratios $948 $2,125 28% 15% 63% 58% 9% 27% Jun-30 Sep-25 Residential real estate Commercial real estate Real estate loans Commercial and industrial, Correspondent banks, and Consumer and other (1) Excludes deferred fees/cost Commentary $501.0 million in gross loan production for year-to-date 2025. 59% of Q3 2025 loan production closed in September; full impact on interest income is expected to be realized in the fourth quarter 2025. The weighted average coupon on new loans was 6.43% for the third quarter of 2025, 22 bps above the portfolio weighted average yield. Continued loan composition shift from real estate loans to non-CRE loans further diversifies our loan portfolio. 9
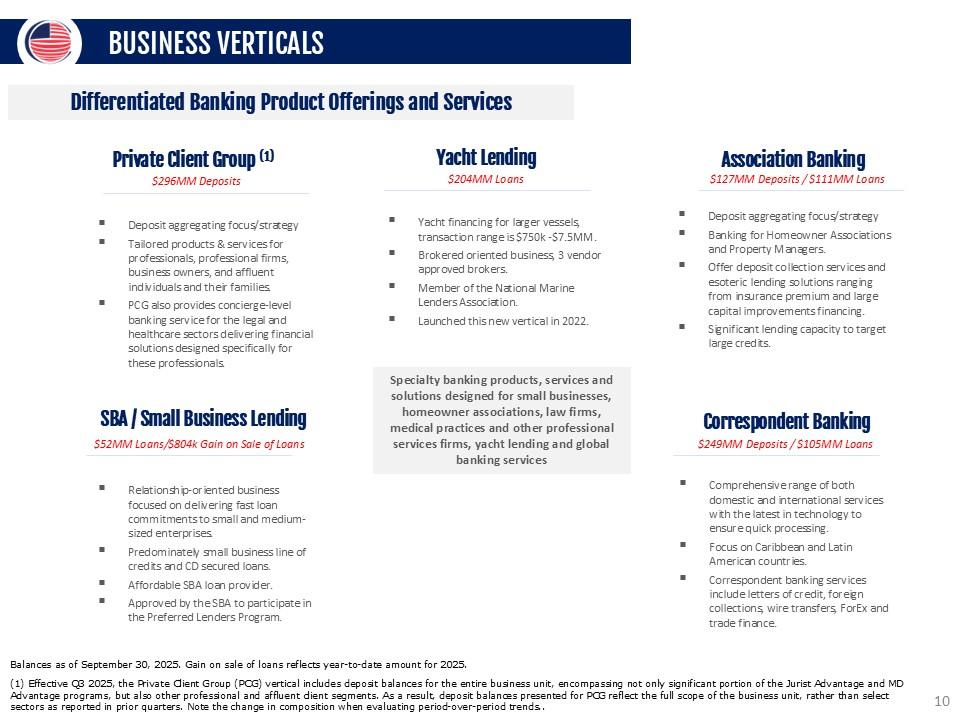
BUSINESS VERTICALS Differentiated Banking Product Offerings and Services Private Client Group (1) $296MM Deposits Deposit aggregating focus/strategy Tailored products & services for professionals, professional firms, business owners, and affluent individuals and their families. PCG also provides concierge-level banking service for the legal and healthcare sectors delivering financial solutions designed specifically for these professionals. Yacht Lending $204MM Loans Yacht financing for larger vessels, transaction range is $750k -$7.5MM. Brokered oriented business, 3 vendor approved brokers. Member of the National Marine Lenders Association. Launched this new vertical in 2022. Association Banking $127MM Deposits / $111MM Loans Deposit aggregating focus/strategy Banking for Homeowner Associations and Property Managers. Offer deposit collection services and esoteric lending solutions ranging from insurance premium and large capital improvements financing. Significant lending capacity to target large credits. SBA / Small Business Lending $52MM Loans/$804k Gain on Sale of Loans Relationship-oriented business focused on delivering fast loan commitments to small and medium-sized enterprises. Predominately small business line of credits and CD secured loans. Affordable SBA loan provider. Approved by the SBA to participate in the Preferred Lenders Program. Specialty banking products, services and solutions designed for small businesses, homeowner associations, law firms, medical practices and other professional services firms, yacht lending and global banking services Correspondent Banking $249MM Deposits / $105MM Loans Comprehensive range of both domestic and international services with the latest in technology to ensure quick processing. Focus on Caribbean and Latin American countries. Correspondent banking services include letters of credit,
foreign collections, wire transfers, ForEx and trade finance. Balances as of September 30, 2025. Gain on sale of loans reflects year-to-date amount for 2025. (1) Effective Q3 2025, the Private Client Group (PCG) vertical includes deposit balances for the entire business unit, encompassing not only significant portion of the Jurist Advantage and MD Advantage programs, but also other professional and affluent client segments. As a result, deposit balances presented for PCG reflect the full scope of the business unit, rather than select sectors as reported in prior quarters. Note the change in composition when evaluating period-over-period trends..+ 10
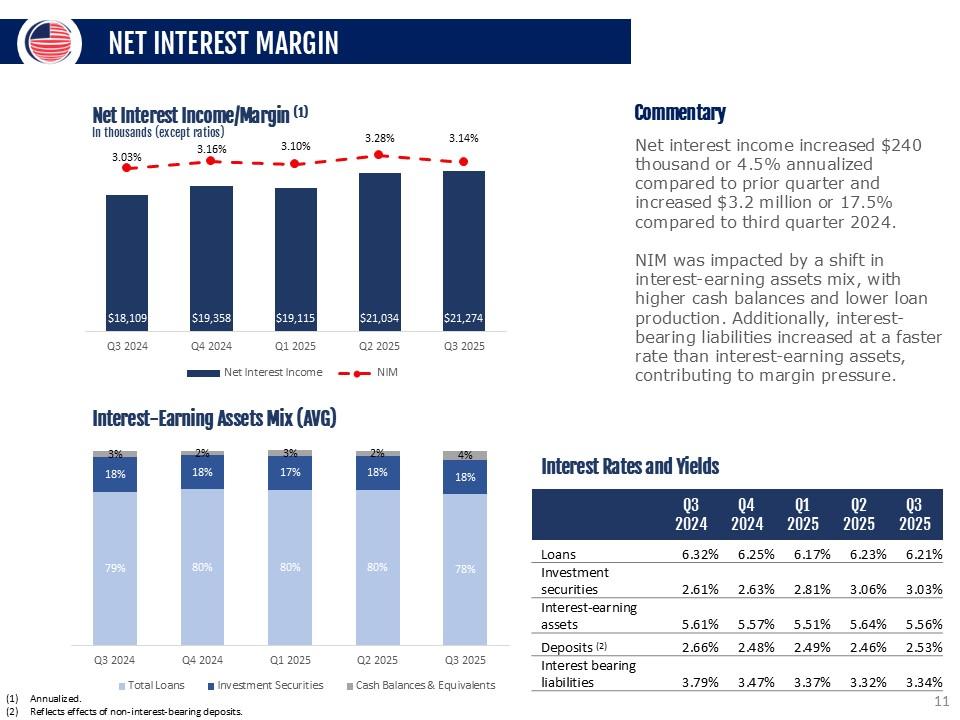
NET INTEREST MARGIN Net Interest Income/Margin (1) In thousands (except ratios) 3.03% 3.16% 3.10% 3.28% 3.14% $18,109 $19,358 $19,115 $21,034 $21,274 Q3 2024 Q4 2024 Q1 2025 Q2 2025 Q3 2025 Net Interest Income Interest-Earning Assets Mix (AVG) 3% 2% 3% 2% 4% 18% 18% 17% 18% 18% 79% 80% 80% 80% 78% Q3 2024 Q4 2024 Q1 2025 Q2 2025 Q3 2025 Total Loans Investment Securities Cash Balances & Equivalents Commentary Net interest income increased $240 thousand or 4.5% annualized compared to prior quarter and increased $3.2 million or 17.5% compared to third quarter 2024. NIM was impacted by a shift in interest-earning assets mix, with higher cash balances and lower loan production. Additionally, interest-bearing liabilities increased at a faster rate than interest-earning assets, contributing to margin pressure. Interest Rates and Yields Q3 2024 Q4 2024 Q1 2025 Q2 2025 Q3 2025 Loans 6.32% 6.25% 6.17% 6.23% 6.21% Investment securities 2.61% 2.63% 2.81% 3.06% 3.03% Interest -earning assets 5.61% 5.57% 5.51% 5.64% 5.56% Deposits (2) 2.66% 2.48% 2.49% 2.46% 2.53% Interest bearing liabilities 3.79% 3.47% 3.37% 3.32% 3.34% Annualized. Reflects eff ects of non-interest-bearing deposits. 11
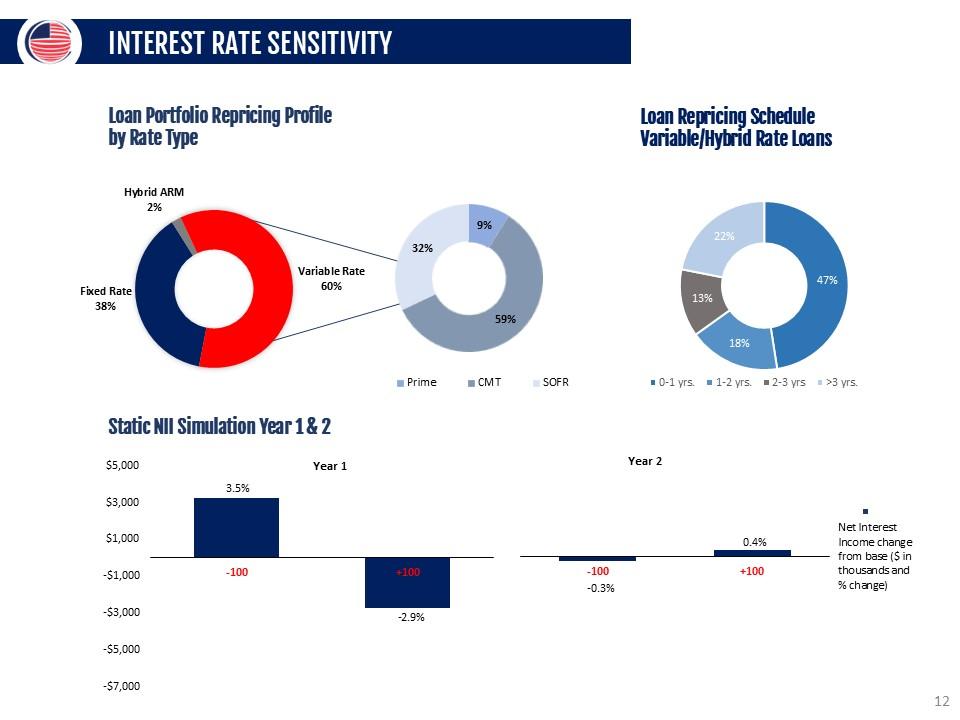
INTEREST RATE SENSITIVITY Loan Portfolio Repricing Profile by Rate Type Hybrid ARM 2% Fixed Rate 38% Variable Rate 60% 32% 9% 59% Prime CMT SOFR 22% 47% 18% 13% yrs. 1-3 yrs. 2-3 yrs. >3 yrs. Static NII Simulation Year 1 & 2 $5,000 Year 1 Year 2 $3,000 $1,000 -$1,000 3.5% -2.9% -0.3% 0.4% Net Interest Income change from base ($ in thousands and % change) -$3,000 -100 +100 -100 +100 -$5,000 -$7,000 12
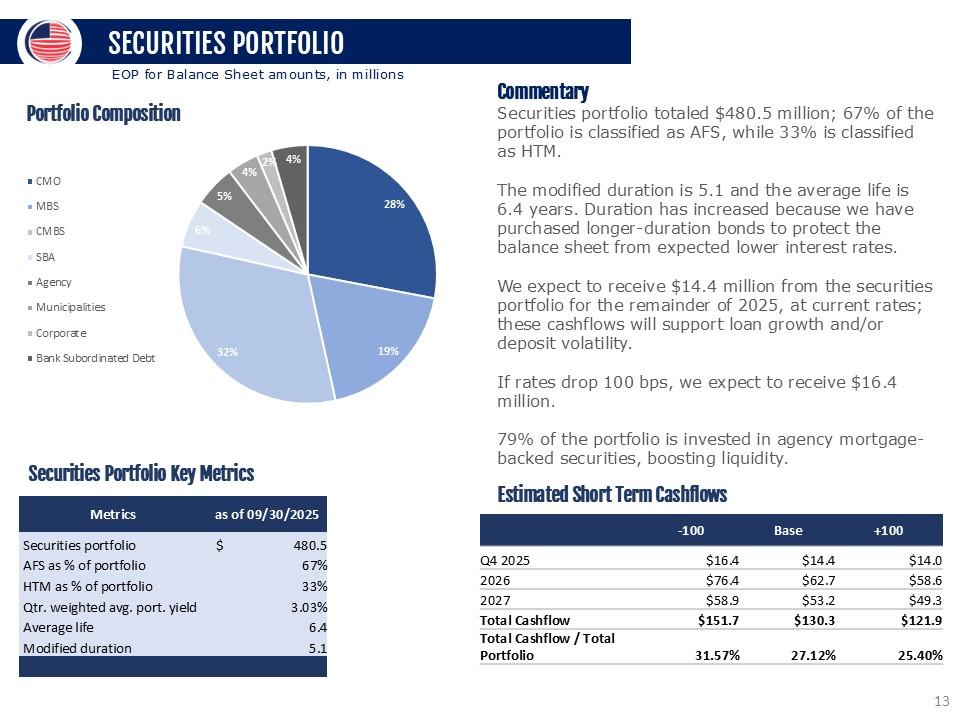
SECURITIES PORTFOLIO EOP for Balance Sheet amounts, in millions Portfolio Composition 5% 4% 2% 4% 28% 19% 32% 6% CMO MBS CMBS SBA Agency Municipalities Corporate Bank Subordinated Debt Securities Portfolio Key Metrics Metrics as of 09/30/2025 Securities portfolio $ 480.5 AFS as % of portfolio 67% HTM as % of portfolio 33% Qtr. weighted avg. port. yield 3.03% Average life 6.4 Modified duration 5.1 Commentary Securities portfolio totaled $480.5 million; 67% of the portfolio is classified as AFS, while 33% is classified as HTM. The modified duration is 5.1 and the average life is 6.4 years. Duration has increased because we have purchased longer-duration bonds to protect the balance sheet from expected lower interest rates. We expect to receive $14.4 million from the securities portfolio for the remainder of 2025, at current rates; these cashflows will support loan growth and/or deposit volatility. If rates drop 100 bps, we expect to receive $16.4 million. 79% of the portfolio is invested in agency mortgage-backed securities, boosting liquidity. Estimated Short Term Cashflows -100 Base +100 Q4 2025 $16.4 $14.4 $14.0 2026 $76.4 $62.7 $58.6 2027 $58.9 $53.2 $49.3 Total Cashflow $151.7 $130.3 $121.9 Total Cashflow / Total Portfolio 31.57% 27.12% 25.40% 13
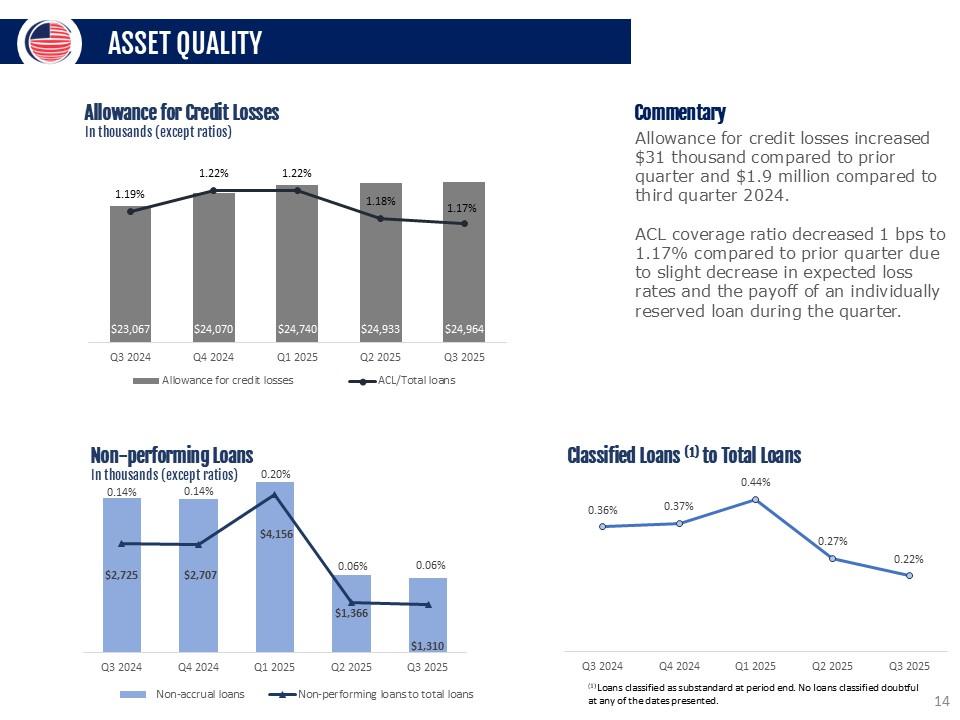
ASSET QUALITY Allowance for Credit Losses In thousands (except ratios) 1.19% 1.22% 1.22% 1.18% 1.17% $23,067 $24,070 $24,740 $24,933 $24,964 Q3 2024 Q4 2024 Q1 2025 Q2 2025 Q3 2025 Allowance for credit losses ACL/Total loans Non-performing Loans In thousands (except ratios) 0.14% 0.14% 0.20% 0.06% 0.06% $2,725 $2,707 $4,156 $1,366 $1,310 Q3 2024 Q4 2024 Q1 2025 Q2 2025 Q3 2025 Non-accrual loans Non-performing loans to total loans Commentary Allowance for credit losses increased $31 thousand compared to prior quarter and $1.9 million compared to third quarter 2024. ACL coverage ratio decreased 1 bps to 1.17% compared to prior quarter due to slight decrease in expected loss rates and the payoff of an individually reserved loan during the quarter. Classified Loans (1) to Total Loans 0.36% 0.37% 0.44% 0.27% 0.22% Q3 2024 Q4 2024 Q1 2025 Q2 2025 Q3 2025 (1) Loans classified as substandard at period end. No loans classified doubtful at any of the dates presented. 14

LOAN PORTFOLIO MIX Loan Portfolio Mix (1) Residential real estate CRE – Owner occupied Cre – Non-owner occupied Commercial and industrial Correspondent banks Consumer and other 10% 15% 9% 48% 13% 5% $2,125 MM (1) CRE Loan Mix Land/Construction 7% Other 2% Retail 26% Multifamily 19% CRE - Owner Occupied 16% Office 10% Warehouse 10% Hotels 10% $1,226MM As of 9/30/25 Excludes deferred fees/cost Includes loan types : office, warehouse, retail, and other Commentary Total loan balance at quarter end was $2,125 million (1). Commercial Real Estate (owner occupied and non-owner occupied) was 57.7% or $1,226 million of the total loan portfolio(1). CRE mix is diversified and granular. Retail non-owner occupied makes up 26% of total CRE or $321.6 million. CRE Loan Portfolio (non-owner occupied and owner occupied) Weighted Average Loan Type Outstanding Balance (1) LTV (2) DSCR (3) Average Loan Size (1) Retail $342 55% 1.53 $3.0 Multifamily $237 57% 1.31 $1.8 Office $187 54% 1.91 $1.6 Warehouse $185 55% 1.62 $1.6 Hotel $121 57% 2.12 $4.5 Other $74 56% 2.01 $1.6 Land/Construction $80 51% NA $3.5 (1) Balance in millions. Excludes deferred fees/cost. (2) LTV - Loan to value ratio. (3) DSCR - Debt service coverage ratio. 15
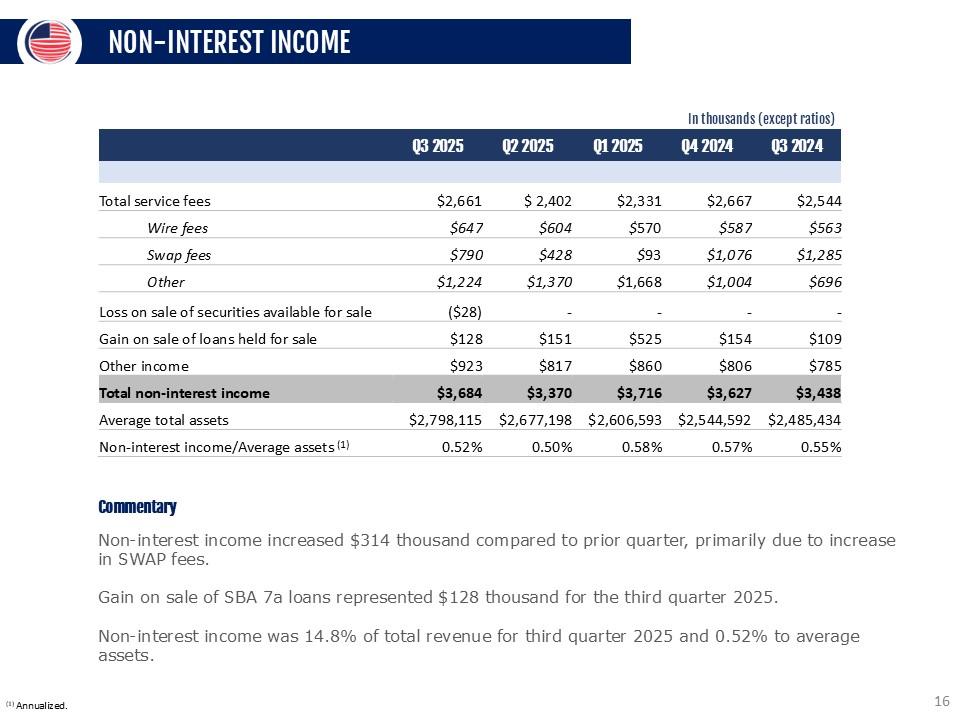
NON-INTEREST INCOME In thousands (except ratios) Q3 2025 Q2 2025 Q1 2025 Q4 2024 Q3 2024 Total service fees $2,661 $ 2,402 $2,331 $2,667 $2,544 Wire fees $647 $604 $570 $587 $563 Swap fees $790 $428 $93 $1,076 $1,285 Other $1,224 $1,370 $1,668 $1,004 $696 Loss on sale of securities available for sale ($28) - - - - Gain on sale of loans held for sale $128 $151 $525 $154 $109 Other income $923 $817 $860 $806 $785 Total non-interest income $3,684 $3,370 $3,716 $3,627 $3,438 Average total assets $2,798,115 $2,677,198 $2,606,593 $2,544,592 $2,485,434 Non-interest income/Average assets (1) 0.52% 0.50% 0.58% 0.57% 0.55% Commentary Non-interest income increased $314 thousand compared to prior quarter, primarily due to increase in SWAP fees. Gain on sale of SBA 7a loans represented $128 thousand for the third quarter 2025. Non-interest income was 14.8% of total revenue for third quarter 2025 and 0.52% to average assets. (1) Annualized. 16
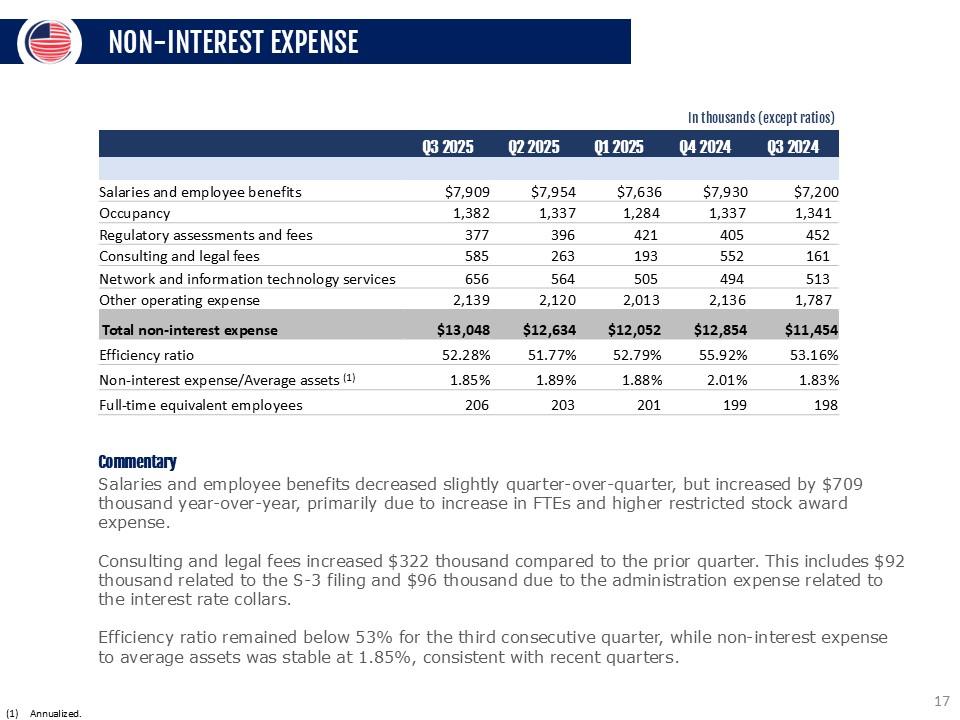
NON-INTEREST EXPENSE In thousands (except ratios) Q3 2025 Q2 2025 Q1 2025 Q4 2024 Q3 2024 Salaries and employee benefits $7,909 $7,954 $7,636 $7,930 $7,200 Occupancy 1,382 1,337 1,284 1,337 1,341 Regulatory assessments and fees 377 396 421 405 452 Consulting and legal fees 585 263 193 552 161 Network and information technology services 656 564 505 494 513 Other operating expense 2,139 2,120 2,013 2,136 1,787 Total non-interest expense $13,048 $12,634 $12,052 $12,854 $11,454 Efficiency ratio 52.28% 51.77% 52.79% 55.92% 53.16% Non-interest expense/Average assets (1) 1.85% 1.89% 1.88% 2.01% 1.83% Full-time equivalent employees 206 203 201 199 198 Commentary Salaries and employee benefits decreased slightly quarter-over-quarter, but increased by $709 thousand year-over-year, primarily due to increase in FTEs and higher restricted stock award expense. Consulting and legal fees increased $322 thousand compared to the prior quarter. This includes an increase of $191 thousand in legal fees, primarily due to $92 thousand related to the S-3 filing during the second quarter 2025. Consulting expenses increased $131 thousand, primarily due to two interest rate collars hedges entered into the quarter. Efficiency ratio remained below 53% for the third consecutive quarter, while non-interest expense to average assets was stable at 1.85%, consistent with recent quarters. Annualized. 17
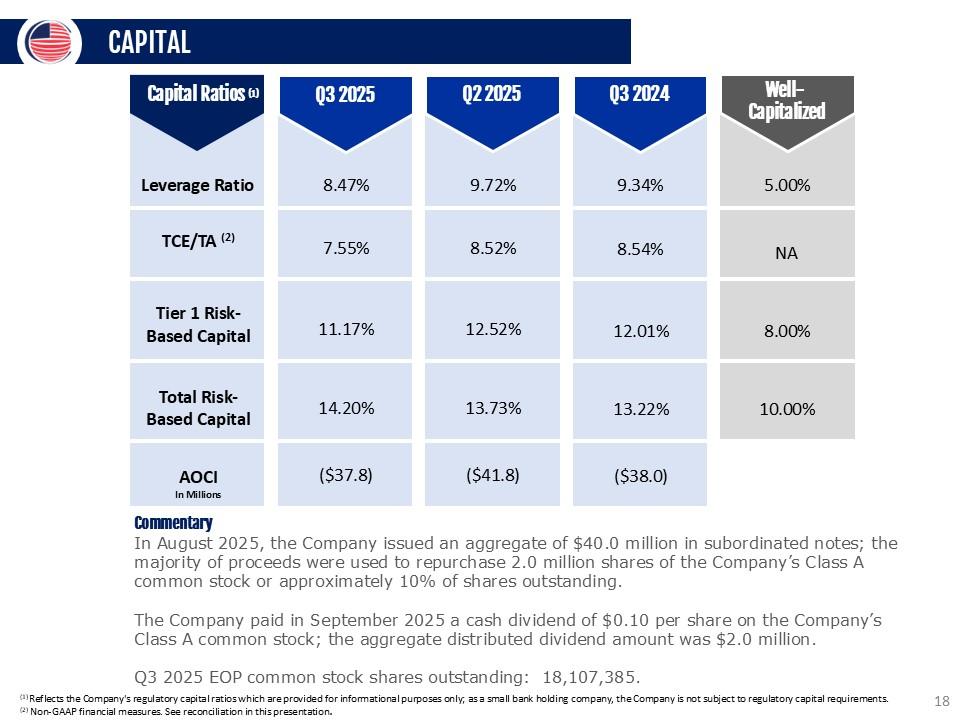
CAPITAL Capital Ratios 00 03 2025 Q22025 9 9 19 V 9 Leverage Ratio 8.47% 9.72% TCE/TA (2) 7.55% 8.52% Tier 1 Risk- Based Capital 11.17% 12.52% Total Risk- Based Capital 14.20% 13.73% AOCI ($37.8) ($41.8) In Millions 992020 4m 9 9 9.34% 5.00% 8.54% NA 12.01% 8.00% 13.22% 10.00% ($38.0) Commentary In August 2025, the Company issued an aggregate of $40.0 million in subordinated notes; the majority of proceeds were used to repurchase 2.0 million shares of the Company’s Class A common stock or approximately 10% of shares outstanding. The Company paid in September 2025 a cash dividend of $0.10 per share on the Company’s Class A common stock; the aggregate distributed dividend amount was $2.0 million. Q3 2025 EOP common stock shares outstanding: 18,107,385. (1) Reflects the Company's regulatory capital ratios which are provided for informational purposes only; as a small bank holding company, the Company is not subject to regulatory capital requirements. (2) Non-GAAP financial measures. See reconciliation in this presentation. 18
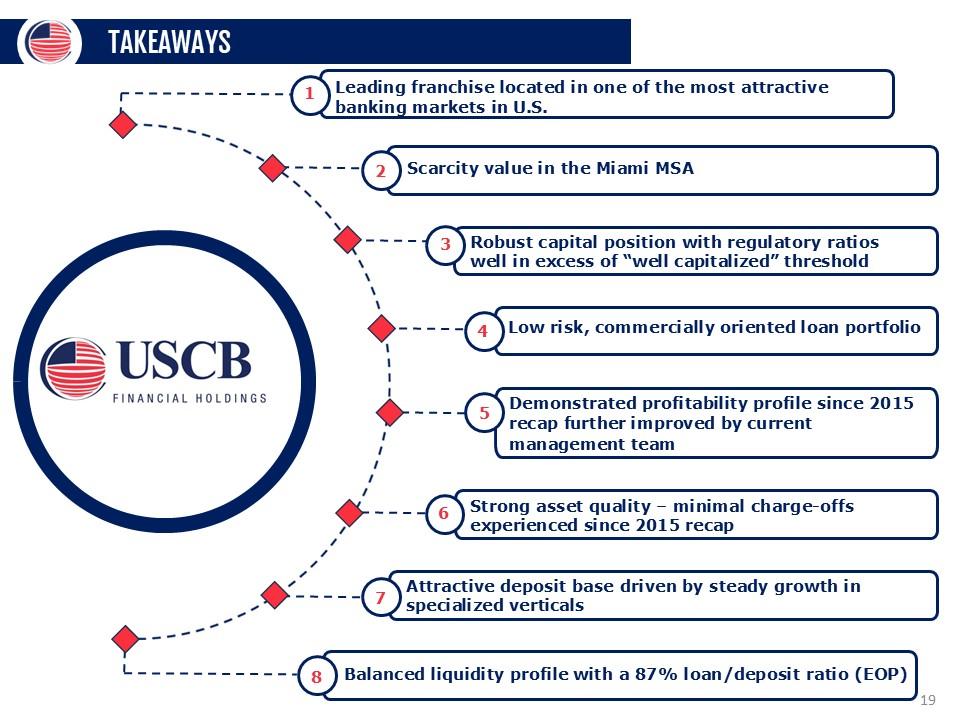
TAKEAWAYS Leading franchise located in one of the most attractive banking markets in U.S. Scarcity value in the Miami MSA Robust capital position with regulatory ratios well in excess of “well capitalized” threshold Low risk, commercially oriented loan portfolio Demonstrated profitability profile since 2015 recap further improved by current management team Strong asset quality – minimal charge-offs experienced since 2015 recap Attractive deposit base driven by steady growth in specialized verticals Balanced liquidity profile with a 87% loan/deposit ratio (EOP) 19
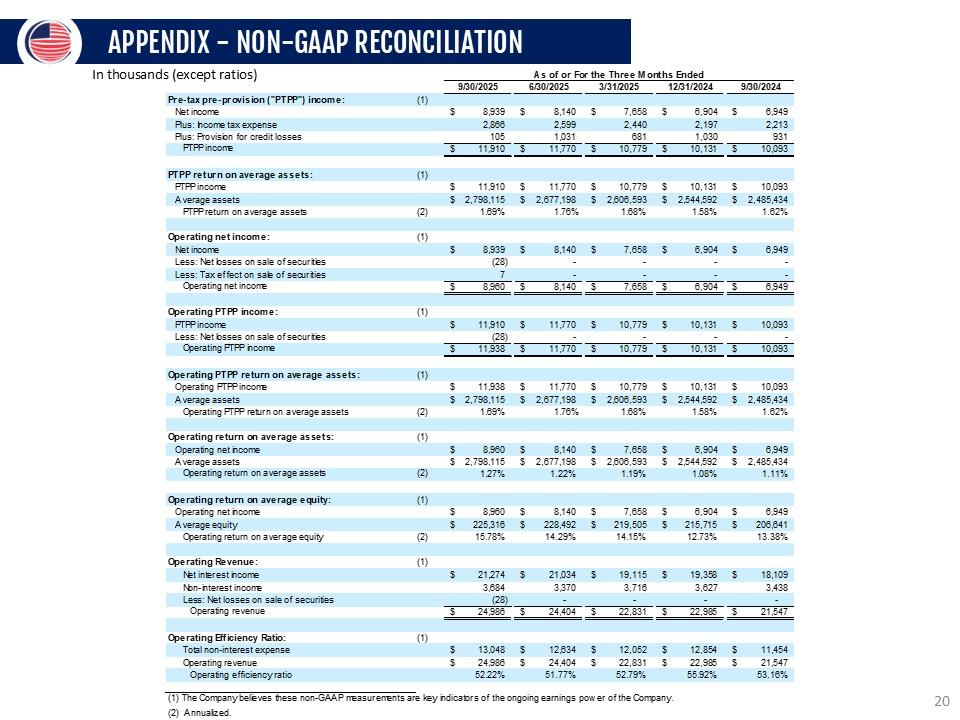
APPENDIX - NON-GAAP RECONCILIATION In thousands (except ratios) 5 (except ratios) As of or For the Three Months Ended 9/30/2025 6/30/2025 3/31/2025 12/31/2024 9/30/2024 Pre-tax pre-provision ("PTPP") income: (1) Net income $ 8,939 $ 8,140 $ 7,658 $ 6,904 $ 6,949 Plus: Income tax expense 2,866 2,599 2,440 2,197 2,213 Plus: Provision for credit losses PTPPincome S 105 11,910 S 1,031 11,770 S 681 10,779 s 1,030 10,131 S 931 10,093 PTPP return on average assets: (1) PTPP income $ 11,910 $ 11,770 $ 10.779 $ 10,131 $ 10,093 Average assets $ 2,798,115 $ 2,677,198 $ 2.606.593 $ 2,544,592 $ 2,485,434 PTPP return on average assets (2) 1.69% 1.76% 1 68% 1.58% 1.62% Operating net incom e: (1) Net income s 8.939 s 8,140 s 7,658 s 6,904 s 6,949 Less: Net losses on sale of securities (28) - - - - Less: Tax effect on sale of securities 7 - - - - Operating net income s 8,960 s 8,140 s 7,658 s 6,904 s 6,949 Operating PTPP income: (1) PTPPincome $ 11,910 $ 11,770 $ 10,779 $ 10,131 $ 10,093 Less: Net losses on sale of securities (28) - - - - Operating PTPP income s _11,938_ s 11,770 s 10,779 s 10,131 s 10,093 Operating PTPP return on average assets: (1) Operating PTPPincome $ 11,938 $ 11,770 $ 10,779 $ 10,131 $ 10,093 Average assets $ 2,798,115 $ 2,677,198 $ 2,606,593 $ 2,544,592 $ 2,485,434 Operating PTPP return on average assets (2) 1.69% 1.76% 1.68% 1.58% 1.62% Operating return on average assets: (1) Operating net income s 8,960 s 8,140 s 7,658 s 6,904 s 6,949 Average assets $ 2,798,115 $ 2,677,198 $ 2,606,593 $ 2,544,592 $ 2,485,434 Operating return on average assets (2) 1.27% 1.22% 1.19% 1.08% 1.11% Operating return on average equity: (1) Operating net income s 8,960 s 8,140 s 7,658 s 6,904 s 6,949 Average equity $ 225,316 $ 228,492 $ 219,505 $ 215,715 $ 206,641 Operating return on average equity (2) 15.78% 14.29% 14.15% 12.73% 13.38%
Operating Revenue: (1) Net interest income “IAM nor-cr ixnocmne s 21,274 o co s 21,034 o 370 s 19,115 o 7Ac s 19,358 o co7 s 18,109 o 13o olklcIco- IIeUIII Less: Net losses on sale of securities Operating revenue c 0,00 f (28) 24 096 c 2A 4QA c •,4 I 22 831 c 29 085 c •,400 21 547 " — —— — — — 2 —— 2 —— — — Operating Efficiency Ratio: (1) Total non-interest expense s 13,048 s 12,634 s 12,052 s 12,854 s 11,454 Operating revenue $ 24,986 $ 24,404 $ 22,831 $ 22,985 $ 21,547 Operating efficiency ratio 52.22% 51.77% 52.79% 55.92% 53.16% 1. The Company believes these non-GAAP measurements are key indicators of the ongoing earnings pow er of the Company. 2. Annualized. 20
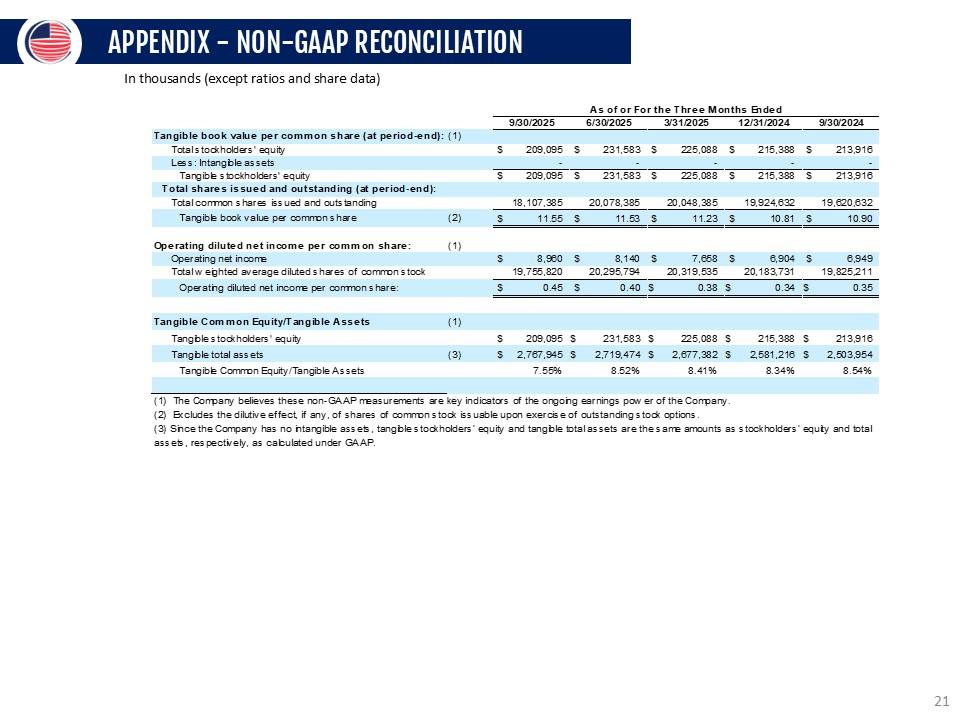
APPENDIX - NON-GAAP RECONCILIATION In thousands (except ratios and share data) As of or For the Three Months Ended 9/30/2025 6/30/2025 3/31/2025 12/31/2024 9/30/2024 Tangible book value per common share (at period-end): (1) Total stockholders' equity S 209,095 S 231,583 S 225,088 S 215,388 S 213,916 Less: Intangible assets - - - - - Tangible stockholders' equity Total shares issued and outstanding (at period-end): S 209,095 $ 231,583 $ 225,088 $ 215,388 $ 213,916 Total common shares issued and outstanding 18,107,385 20,078,385 20,048,385 19,924,632 19,620,632 Tangible book value per common share (2) S 11.55 $ 11.53 $ 11.23 $ 10.81 $ 10.90 Operating diluted net income per common s hare: (1) Operating net incorre $ 8,960 $ 8,140 $ 7,658 $ 6,904 $ 6,949 Total weighted average diluted shares of common stock 19,755,820 20,295,794 20,319,535 20,183,731 19,825,211 Operating diluted net income per common share: $ 0.45 $ 0.40 $ 0.38 s 0.34 s 0.35 Tangible Common Equity/Tangible Assets (1) Tangible stockholders' equity S 209,095 S 231,583 S 225,088 S 215,388 S 213,916 Tangible total assets (3) $ 2,767,945 $ 2,719,474 $ 2,677,382 $ 2,581,216 $ 2,503,954 Tangible Common Equity/Tangible Assets 7.55% 8.52% 8.41% 8.34% 8.54% 1. The Company believes these non-GAAP measurements are key indicators of the ongoing earnings pow er of the Company. 2. Excludes the dilutive effect, if any, of shares of common stockissuable upon exercise of outstanding stockoptions. 3. Since the Company has no intangible assets, tangible stockhol ders' equity and tangible total assets are the same amounts as stockholders' equity and total assets, respectively, as calculated under GAAP. 21

CONTACT INFORMATION LOU DE LA AGUILERA Chairman, President & CEO (305) 715-5186 laguilera@uscentury.com ROB ANDERSON EVP, Chief Financial Officer (305) 715-5393 rob.anderson@uscentury.com INVESTOR RELATIONS InvestorRelations@uscentury.com 22